Every day, thousands of sensors across Canada quietly collect data that shapes our understanding of climate change. From weather stations perched on Arctic ice to satellites orbiting overhead, these instruments form an intricate network that tracks temperature, precipitation, greenhouse gas concentrations, and atmospheric conditions with remarkable precision.
Canada’s approach to climate measurement has evolved significantly by 2026. The federal government coordinates data through Environment and Climate Change Canada, which operates over 1,400 climate monitoring stations nationwide. These stations feed information into the National Inventory Report, a comprehensive document that tracks greenhouse gas emissions and removals across all sectors of the economy. The report follows methodologies established by the Intergovernmental Panel on Climate Change, ensuring our measurements align with international standards and remain comparable with data from other nations.
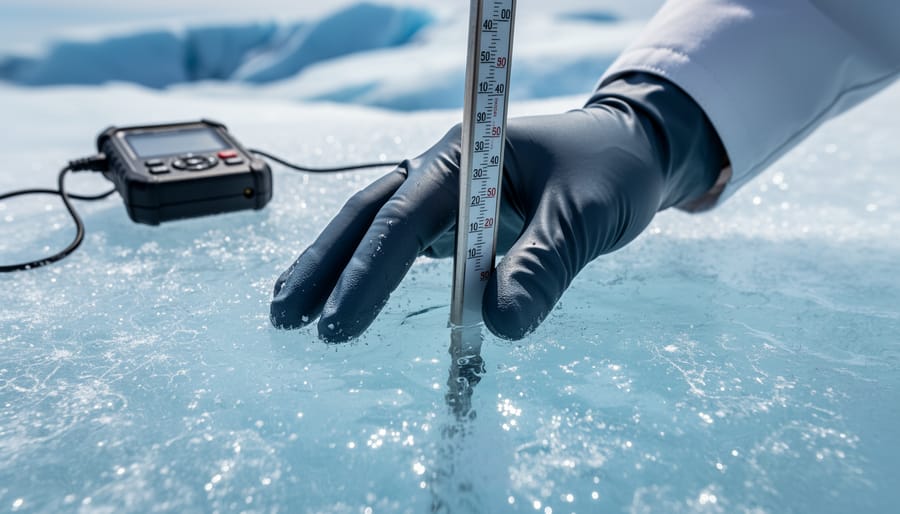
But climate measurement extends far beyond simple thermometers. Scientists use sophisticated instruments like spectrometers to analyze atmospheric composition, ocean buoys to monitor sea temperatures, and ice cores to reconstruct historical climate patterns. Satellites provide crucial data on forest cover, glacial retreat, and land use changes. Ground-based sensors track soil moisture and permafrost thaw rates across northern regions.
What makes Canada’s climate monitoring particularly innovative is the integration of Indigenous knowledge systems alongside Western scientific methods. Communities that have observed environmental changes for generations contribute invaluable context that helps researchers interpret data and identify trends that instruments alone might miss.
Understanding these measurement systems matters for everyone, from policymakers designing emission reduction strategies to individuals making home energy choices. The data collected today informs the climate solutions we’ll implement tomorrow.
The Difference Between Weather and Climate Measurement
When someone checks their phone each morning to see if they need an umbrella, they’re looking at weather. When scientists track how many extreme rainfall events have increased across Canada over 30 years, they’re measuring climate. The distinction matters because the tools, timeframes, and purpose of each type of measurement are fundamentally different.
Weather describes atmospheric conditions at a specific place and time, today’s temperature, tomorrow’s chance of snow, this weekend’s forecast. Weather measurements focus on short-term prediction, typically looking hours to weeks ahead. Climate, by contrast, describes long-term patterns and averages, typically measured over periods of 30 years or longer. It’s the difference between asking “will it rain on Tuesday?” and “is precipitation in southern Ontario increasing over time?”
This distinction demands different measurement approaches. Weather forecasting relies on real-time data from thousands of observation points, sophisticated computer models that predict atmospheric behaviour, and rapid updates as conditions shift. Climate measurement requires consistent, standardized data collection over decades, analysis of statistical trends across multiple variables, and systems designed to detect subtle but significant changes in Earth’s energy balance.
Climate scientists track variables that reveal systemic shifts, not just whether this winter was colder than last, but whether winters across Canada have warmed measurably since the 1990s. They examine changes in extreme events, seasonal timing, precipitation patterns, ice coverage, and ocean chemistry. These measurements require different infrastructure than weather stations alone can provide, including satellite monitoring, ocean buoys, ice cores, and coordinated international observation networks that maintain data consistency across generations.
The timescales also shape what counts as meaningful. A single hot summer doesn’t indicate climate change. Ten consecutive years of above-average temperatures, coupled with earlier spring thaw dates, reduced snowpack, and shifting growing seasons, does. Climate measurement filters out the noise of daily variation to reveal the signal of long-term change.
What Canada Actually Measures: Beyond Temperature
Canada’s climate measurement system extends far beyond the thermometer readings that dominate headlines. When we ask how climate is measured in Canada, the answer involves tracking multiple interconnected indicators that together reveal the full scope of environmental change.
Greenhouse gas emissions sit at the core of Canada’s measurement efforts. The country monitors all major greenhouse gases, carbon dioxide, methane, nitrous oxide, and fluorinated compounds, tracking both where they come from and where natural systems absorb them. This comprehensive accounting covers every emission source from oil and gas operations to agriculture, transportation, and industrial processes. Unlike temperature, which reflects climate impacts, greenhouse gas measurements capture the primary driver of climate change itself.
Temperature trends remain crucial, but Canada measures them as long-term patterns rather than daily fluctuations. Scientists track changes in average temperatures across seasons and regions, watching for shifts in both highs and lows. These measurements reveal asymmetric warming, Canada’s winters warming faster than summers, and northern regions changing more rapidly than southern areas.
Precipitation patterns tell a story that temperature alone cannot. Canada monitors total rainfall and snowfall amounts, the timing of precipitation events, and the increasing frequency of extreme weather. These measurements show how climate change redistributes water across the country, creating droughts in some regions while intensifying flooding risks in others.
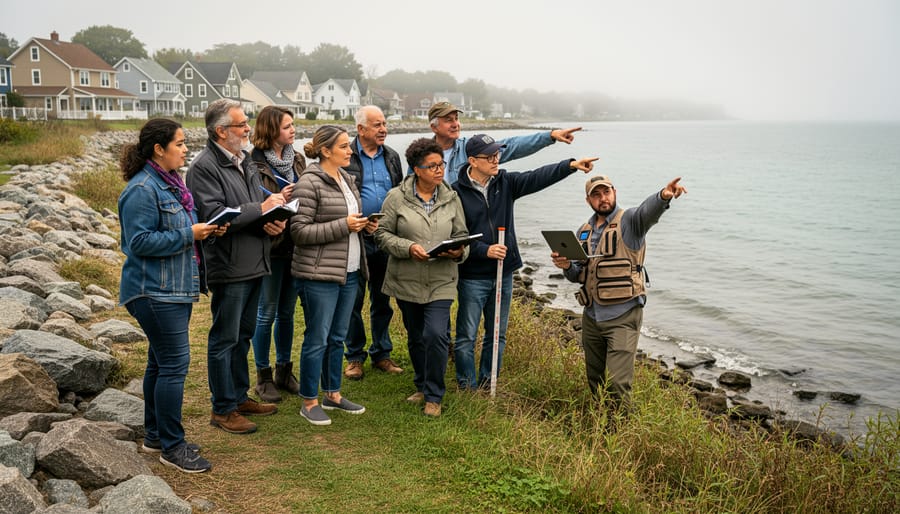
Sea level measurements along Canada’s three coasts track both global ocean rise and regional variations caused by land movement and ocean dynamics. Atlantic Canada faces different sea level challenges than the Pacific coast, making location-specific measurements essential for coastal communities planning infrastructure and adaptation strategies.
Ice coverage monitoring spans Arctic sea ice extent, glacier mass balance, permafrost temperatures, and the timing of lake and river freeze-up across the country. These measurements serve as sensitive indicators of warming, with ice responding faster to temperature changes than many other systems.
Ecosystem shifts round out Canada’s measurement framework. Scientists track changes in growing seasons, wildlife migration patterns, forest health, and the northward movement of species ranges. These biological indicators reveal climate impacts that purely physical measurements might miss, showing how warming reshapes Canada’s natural systems from the ground up.
Canada’s National Greenhouse Gas Inventory: The Annual Climate Report Card
How the Data Gets Collected
Behind Canada’s annual emissions inventory sits a complex data-gathering operation that pulls from every corner of the economy. Environment and Climate Change Canada doesn’t measure emissions directly at every smokestack and tailpipe. Instead, the system relies on activity data, hard numbers that describe what Canadians actually did during a given year.
This activity data comes in many forms. Industrial facilities report production figures in physical units: tonnes of steel manufactured, barrels of oil extracted, cubic metres of natural gas burned. Statistics Canada provides GDP indicators that track economic activity across sectors. Demographic data captures population changes, household formation, and vehicle registrations. Energy utilities report fuel sales and electricity generation by source. Agricultural agencies track livestock populations, fertilizer use, and land management practices.
The real challenge is speed. Canada’s official inventory typically arrives in April, a full 16 months after the year it measures ends. That lag exists because comprehensive, verified activity data takes time to compile across thousands of reporting entities.
To address this gap, the 440 Megatonnes early estimate offers a faster alternative. This initiative combines partial activity data with historical decarbonization trends, tracking how energy efficiency improvements, fuel switching, and other measures have reduced greenhouse gas intensity per unit of production over time. By applying these established patterns to preliminary 2024 activity data, analysts can project emissions months before the official count arrives, giving policymakers and the public earlier insights into Canada’s climate trajectory.
The 16-Month Challenge: Why Climate Data Takes Time
Canada’s official greenhouse gas inventory, published each April, reports data from 16 months earlier, meaning the 2026 report released this past April covered emissions through the end of 2024. This timing isn’t bureaucratic delay. Compiling the inventory requires waiting for industry to finalize production records, energy companies to reconcile fuel sales, provinces to submit land-use data, and thousands of facilities to report emissions. Then Environment and Climate Change Canada’s analysts must verify accuracy, apply the 2006 IPCC Guidelines methodology, and undergo quality checks before submission to the UNFCCC.
For policymakers tracking progress toward 2030 targets, a 16-month information gap creates real challenges. The 440 Megatonnes initiative addresses this by producing an Early Estimate using available activity data, industry production figures, GDP trends, demographic shifts, combined with historical decarbonization patterns like energy efficiency improvements and fuel switching. While less precise than the official inventory, these estimates give decision-makers timely signals about whether Canada’s emissions trajectory is improving or stalling, allowing course corrections rather than waiting until next April to discover last year’s results.
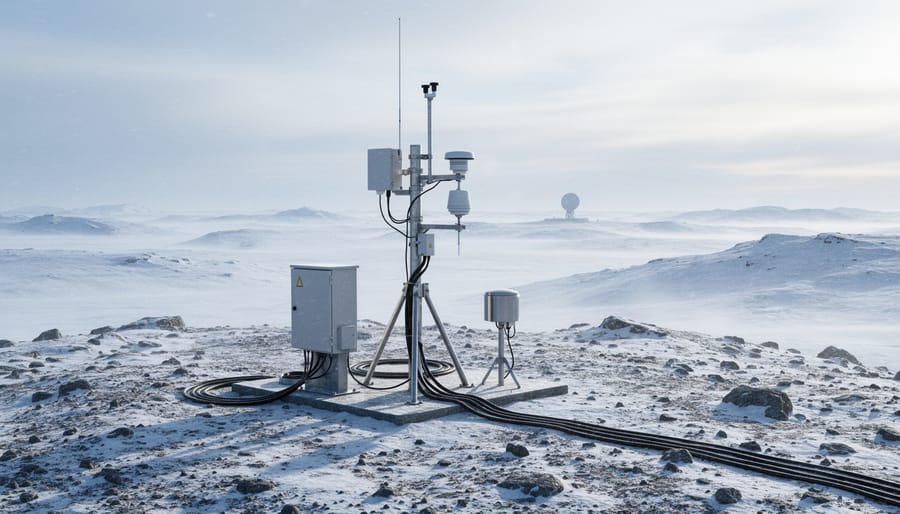
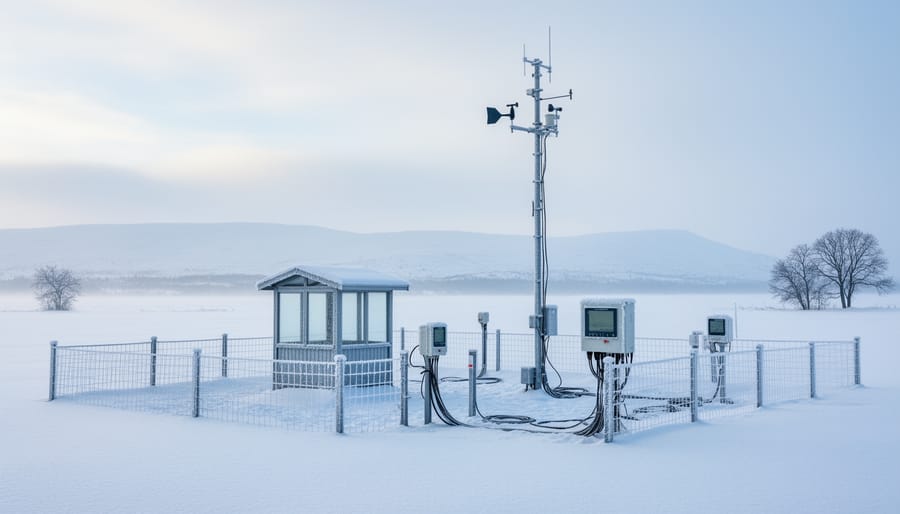
Ground Truth: How Measurements Are Actually Taken
Canada’s climate measurement system relies on a vast network of observation tools working together across one of the world’s largest and most geographically diverse countries. Weather stations scattered from the Arctic to southern cities continuously record temperature, precipitation, humidity, and atmospheric pressure. These ground-based instruments provide the long-term records that reveal changing patterns over decades.
Satellites orbiting overhead capture a broader view. They track ice extent in the Arctic, monitor vegetation changes, measure sea surface temperatures, and observe atmospheric composition from space. This bird’s-eye perspective fills gaps in remote regions where ground stations are sparse or impossible to maintain year-round.
Ocean buoys positioned along Canada’s coastlines measure water temperature, salinity, and currents, critical data for understanding how warming affects marine ecosystems and sea level rise. In the North, ice monitoring stations track thickness, extent, and the timing of freeze-up and breakup, documenting shifts that Indigenous communities have observed firsthand.
Ecosystem observation networks add another layer. Scientists monitor forest health, wetland conditions, permafrost stability, and wildlife migration patterns. These biological indicators reveal climate impacts that temperature readings alone might miss.
The challenge is scale. Canada spans six time zones and includes tundra, boreal forest, prairies, mountains, and three ocean coastlines. Maintaining comprehensive coverage requires coordination between federal agencies, provincial monitoring programs, universities, and research stations. While specific details about current instruments aren’t fully documented here, the general framework reflects decades of investment in building a measurement infrastructure capable of tracking environmental change across this immense geography.
Together, these tools create the observational foundation that feeds into Canada’s official greenhouse gas inventory and climate assessments.
Indigenous Knowledge and Community-Based Monitoring
For thousands of years, Indigenous peoples across Canada have observed seasonal patterns, animal migrations, ice formation, and plant growth cycles, creating detailed records of environmental conditions that predate modern scientific measurement by millennia. These knowledge systems continue to track climate changes with remarkable precision, often detecting shifts in caribou migration routes, declining permafrost stability, changes in berry ripening times, and alterations to sea ice thickness that instrumental monitoring hasn’t yet registered.
Community-based monitoring programs now bridge traditional knowledge and Western science across Canada’s North. Inuit hunters in Nunavut document ice conditions through smartphone apps that feed real-time observations to researchers, while First Nations communities in British Columbia maintain long-term records of salmon run timing and river temperature changes that complement government fisheries data. These programs fill critical gaps in Canada’s measurement infrastructure, particularly in vast Arctic and sub-Arctic regions where placing and maintaining scientific instruments proves logistically challenging and prohibitively expensive.
The integration of Indigenous knowledge into climate measurement systems strengthens Canada’s overall understanding of environmental change. Traditional observers notice interconnected ecosystem shifts, how warming temperatures affect not just temperature readings but entire food webs, cultural practices, and landscape stability. When a Cree elder reports that lakes freeze two weeks later than in previous generations, or when Inuit knowledge holders document new insect species appearing in the Arctic, they’re providing climate measurements that no satellite or weather station can capture. This complementary approach, combining quantitative instrumental data with qualitative observational knowledge, creates a more complete picture of how climate change is reshaping Canada’s diverse landscapes.
Why Accurate Climate Measurement Matters for Canada’s Clean Energy Transition
Canada’s clean energy transition depends entirely on knowing whether we’re making progress. Without accurate measurement systems tracking emissions at the sector level, policymakers would be designing climate strategies in the dark, unable to identify which interventions work and which fall short.
The National Inventory Report doesn’t just satisfy international obligations, it shapes domestic action. When the 2026 submission revealed emissions trends across transportation, electricity generation, heavy industry, and agriculture, it gave federal and provincial governments concrete data to allocate clean technology funding, adjust carbon pricing mechanisms, and set realistic interim targets for 2030 and 2035. Alberta’s industrial emissions data informed decisions about carbon capture investment priorities. The electricity mix in BC measurements validated the province’s hydroelectric advantage and guided grid expansion planning.
Measurement drives private sector investment too. Venture capital flowing into Canadian cleantech companies relies on credible emissions baselines to assess market opportunity. A startup developing industrial heat pumps needs to know exactly where thermal energy emissions concentrate. Solar developers planning projects in Ontario need precipitation and temperature data to model generation reliability.
The 440 Megatonnes Early Estimate project exemplifies how closing the 16-month data gap creates faster feedback loops. By providing preliminary emissions figures months ahead of the official inventory, it lets policymakers adjust course without waiting until April of the following year. This turns climate commitments into action with greater agility.
Measurement also creates accountability. Public access to granular emissions data by province, sector, and gas type means journalists, researchers, and advocacy groups can track whether governments meet announced targets. Transparency built into the measurement system makes greenwashing harder and genuine progress visible.
Canada’s climate measurement systems represent some of the most sophisticated environmental monitoring infrastructure in the world. The National Inventory Report, submitted to the UNFCCC using the rigorous 2006 IPCC Guidelines, demonstrates our commitment to tracking every metric that matters, from emissions by source to removals by sink. Combined with satellite networks, ground stations, community-based monitoring, and Indigenous knowledge systems, these tools give us an increasingly clear picture of how our climate is changing and where our interventions work.
This precision matters because you can’t manage what you don’t measure. Every tonne of emissions tracked, every temperature trend documented, and every ecosystem shift recorded informs the policies and innovations driving Canada’s clean energy transition. As measurement technologies improve and reporting timelines shrink, we’ll accelerate our ability to respond to climate challenges with targeted solutions.
The question isn’t whether we can measure climate change accurately enough to act, we already do. The real opportunity lies in using these sophisticated systems to build a cleaner, more resilient Canada that leads by example.